Dashboard
Your results, day by day
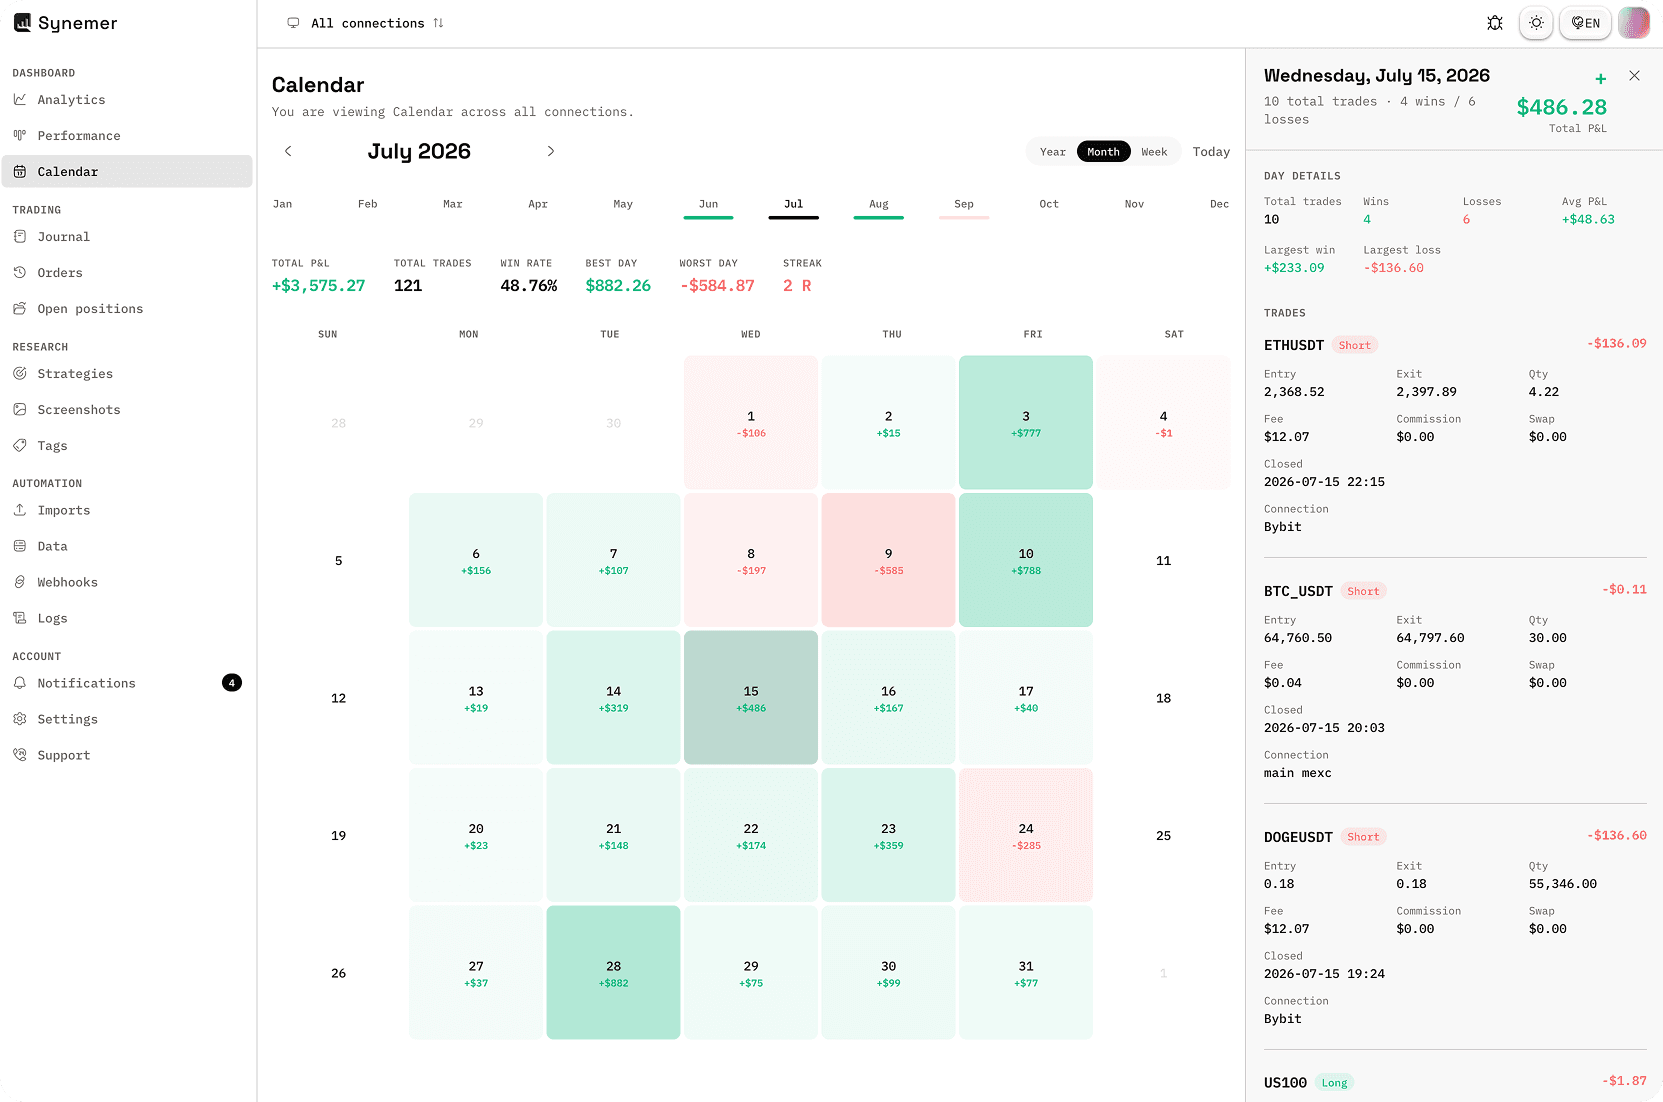
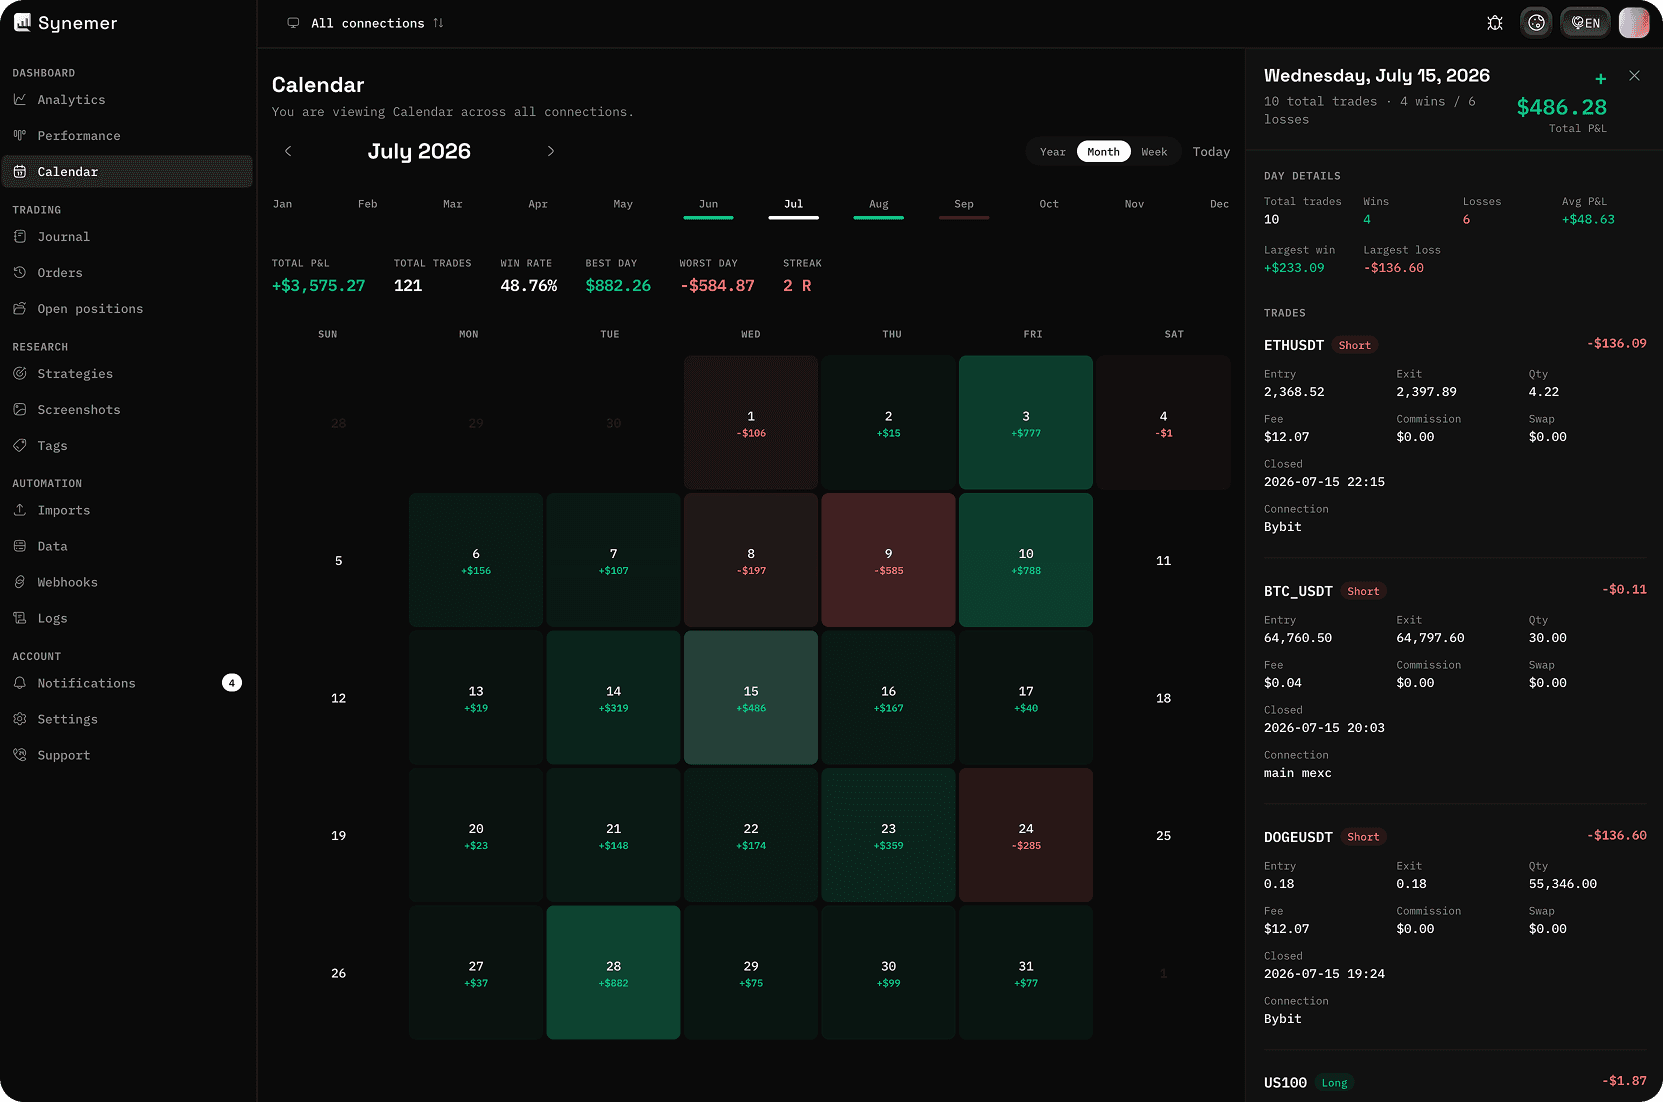
See the rhythm of your trading with a P&L calendar heatmap, month, week and year views, plus streaks and best and worst days.
Spot which days and conditions consistently work for you.
app.synemer.com
What you get
- Daily P&L heatmap
- Year, month and week views
- Streaks, best and worst day and month
Ready to build your routine?
Connect your first account and start reviewing trades in minutes.
Free plan included. No card required.